AV++® Analytics
Real-Time Dashboards. Long-Term Planning. Actionable Data.
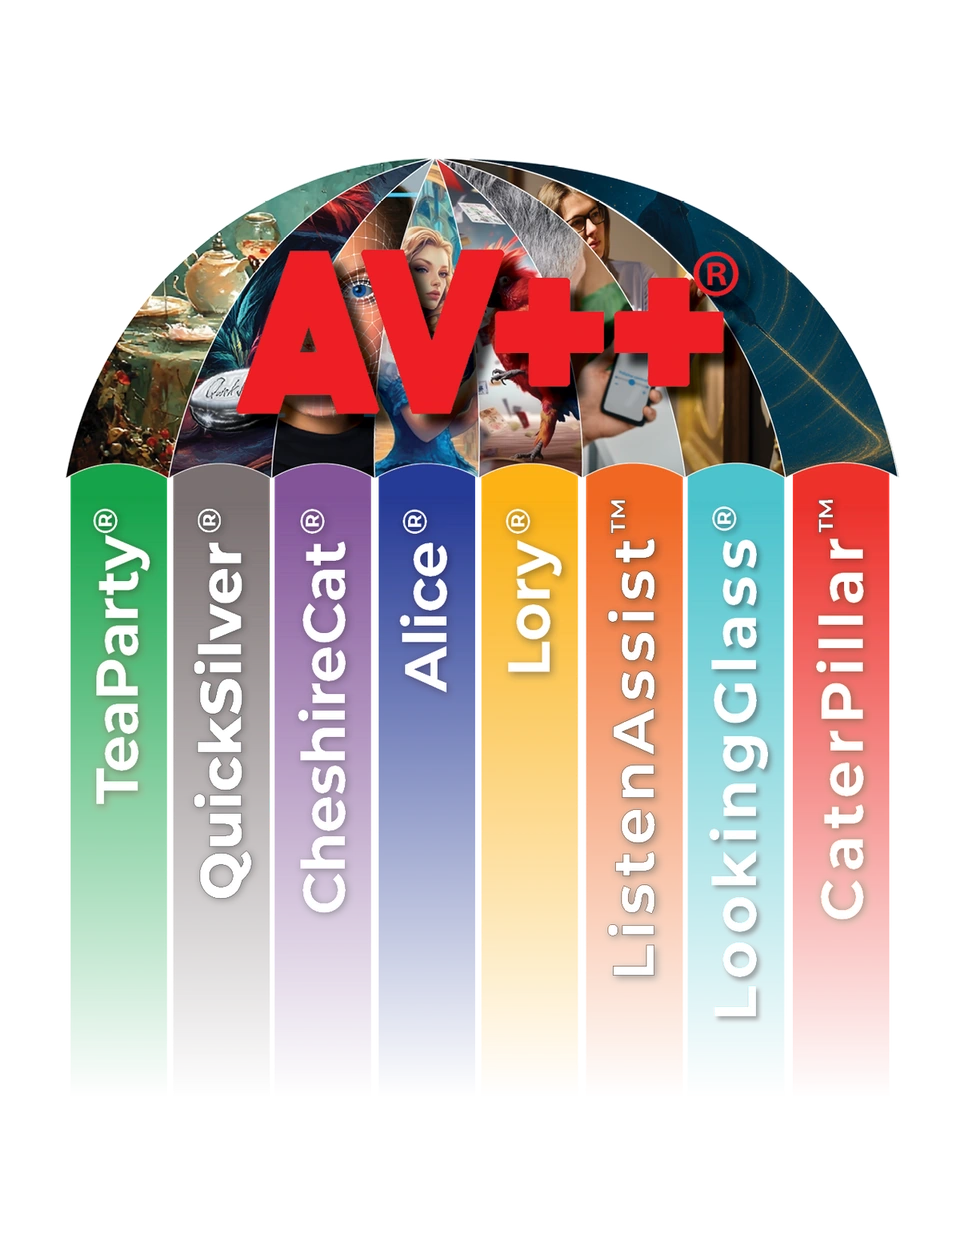
AV++® Analytics brings the operational information generated by a configured installation into views that venue teams can use. Depending on the included inputs, that can mean zone use, dwell time, interaction counts, selected content paths, completed presentations or equipment state.
Each report begins with a question and a defined data source. A curator might compare use of two authored content paths; an operator might investigate an unexpected change in a zone’s activity; a support team might examine repeated equipment exceptions. Selected Alice, CheshireCat, LookingGlass or TeaParty integrations can contribute when they are included and their data use is permitted. Dwell and completion can inform an investigation, but do not alone prove learning, satisfaction, causation or the reason for a return visit.
Measurement and Reporting Features
Current observations
View the relevant inputs available from the configured installation, with update time, coverage and missing data visible.
Dwell observations
Report time in a configured zone or interaction where the selected measurement method supports it. Explain how that quantity was derived.
Interaction measures
Count the supported starts, choices and completions. Separate recorded behavior from interpretations about interest or learning.
Comparable periods
Compare use and performance over defined periods while accounting for changed content, opening hours, sensor coverage and data completeness.
Selected integrations
Combine the data sources included in the project. An AV++ installation does not automatically report every technology or every visitor interaction.
Defined data use
Establish the purpose, permitted inputs, aggregation, access and retention. WorldModel™ governance applies where included in the integration.
Make observations useful to the team.
The selected operational and interaction records support questions about use, layout and future development.
Explore the sensing story ↗AV++® Analytics turns venue operations from intuition-driven to data-informed.
For venue flow observations, zone routing, and live operational response, see LookingGlass® Concierge →
TECHNICAL DETAILGive every measure a definition.
Open the engineering detailClose this sectionLook for the red circuit symbol for engineering detail.
Illustrative report: compare starts and completions of two approved narration lengths over the same operating period. Retain the selected version, reporting window, included stations and missing-data conditions. The comparison can help decide what to investigate; it does not establish why a visitor stopped.
The implementation defines which observations are anonymous aggregates and which depend on a permitted session. Optional member continuity is a separate data choice. Access, retention, export and deletion responsibilities are specified with the report.
FROM OBSERVATIONS TO USEFUL QUESTIONS
Know what the data describes.
CheshireTracks™ develops privacy-conscious camera sensing for occupancy heat maps and movement information. Those aggregate observations can contribute to AV++® Analytics and the operating context used by LookingGlass®.
Usage and dwell describe observed behavior. They give the team useful questions to investigate alongside visitor feedback and operational knowledge.